Your node is running. Now make sure you actually know when something goes wrong.
Why Monitoring Is Not Optional
Your validator is live. Blocks are being signed. Everything feels fine.
Until it isn’t.
A missed upgrade, a memory leak, a peer count drop, a disk filling up at 3 AM — these are not edge cases. They are the routine reality of running production infrastructure. The difference between a validator with 99.9% uptime and one that gets jailed isn’t always hardware quality or software skill. It’s visibility.
Prometheus + Grafana is the standard monitoring stack for Cosmos validators — battle-tested, widely adopted, and deeply integrated into the Cosmos SDK. This guide assumes your node is already running and walks you through adding a complete monitoring layer on top of it.
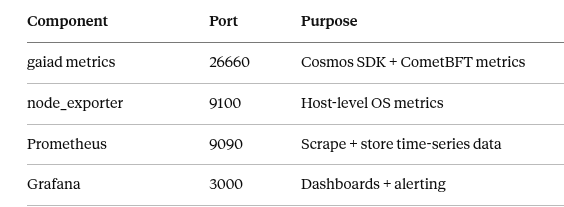
Architecture Overview
Before touching a config file, understand what you’re building:
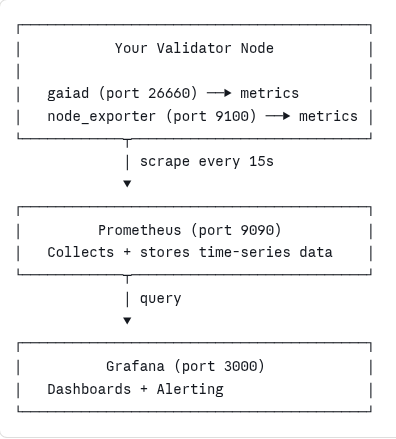
- Cosmos SDK metrics — your gaiad process exposes validator-specific metrics over HTTP
- node_exporter — exposes host-level metrics (CPU, RAM, disk, network)
- Prometheus — scrapes both endpoints and stores time-series data
- Grafana — queries Prometheus and renders dashboards and alerts
All four components can run on the same server for a single-node setup, or you can run Prometheus + Grafana on a separate monitoring server for better isolation.
Step 1: Enable Metrics on Your Cosmos Node
Your node exposes Prometheus metrics natively — you just need to turn it on.
Open config.toml:
nano ~/.gaia/config/config.toml
Find the instrumentation section and enable it:
#######################################################
###       Instrumentation Configuration             ###
#######################################################
[instrumentation]
# Enable Prometheus metrics
prometheus = true
# Address to listen on
prometheus_listen_addr = ":26660"
# Maximum number of simultaneous connections
max_open_connections = 3
# Instrumentation namespace
namespace = "cometbft"
Also check app.toml for application-level metrics (Cosmos SDK v0.47+):
[telemetry]
enabled = true
prometheus-retention-time = 600  # seconds
Restart your node to apply:
sudo systemctl restart gaiad
Verify metrics are being exposed:
curl -s localhost:26660/metrics | head -40
You should see output like:
# HELP cometbft_consensus_height Height of the chain
# TYPE cometbft_consensus_height gauge
cometbft_consensus_height 15482300
# HELP cometbft_consensus_validators Number of validators
# TYPE cometbft_consensus_validators gauge
cometbft_consensus_validators 18
If you see this, your node is ready to be scraped.
Step 2: Install node_exporter
node_exporter exposes host-level metrics — CPU, memory, disk, network. Essential for catching infrastructure problems before they affect your validator.
# Download latest node_exporter
cd /tmp
wget https://github.com/prometheus/node_exporter/releases/download/v1.7.0/node_exporter-1.7.0.linux-amd64.tar.gz
# Extract
tar xvfz node_exporter-1.7.0.linux-amd64.tar.gz
# Move binary
sudo mv node_exporter-1.7.0.linux-amd64/node_exporter /usr/local/bin/
# Create dedicated user
sudo useradd -rs /bin/false node_exporter
Create a systemd service:
sudo nano /etc/systemd/system/node_exporter.service
[Unit]
Description=Node Exporter
After=network.target
[Service]
User=node_exporter
Group=node_exporter
Type=simple
ExecStart=/usr/local/bin/node_exporter \
  --collector.systemd \
  --collector.processes
[Install]
WantedBy=multi-user.target
Enable and start:
sudo systemctl daemon-reload
sudo systemctl enable node_exporter
sudo systemctl start node_exporter
# Verify
curl -s localhost:9100/metrics | head -10
Step 3: Install Prometheus
cd /tmp
wget https://github.com/prometheus/prometheus/releases/download/v2.50.0/prometheus-2.50.0.linux-amd64.tar.gz
tar xvfz prometheus-2.50.0.linux-amd64.tar.gz
sudo mv prometheus-2.50.0.linux-amd64/prometheus /usr/local/bin/
sudo mv prometheus-2.50.0.linux-amd64/promtool /usr/local/bin/
# Create directories
sudo mkdir -p /etc/prometheus /var/lib/prometheus
sudo useradd -rs /bin/false prometheus
sudo chown prometheus:prometheus /var/lib/prometheus
Configure Prometheus
Create the main config file:
sudo nano /etc/prometheus/prometheus.yml
global:
  scrape_interval: 15s
  evaluation_interval: 15s
  external_labels:
    chain: cosmoshub
    validator: your-moniker   # replace with your validator moniker
# Alerting rules (we'll add these in Step 5)
rule_files:
  - /etc/prometheus/alerts.yml
scrape_configs:
  # Cosmos node metrics (CometBFT + SDK)
  - job_name: cosmos_node
    static_configs:
      - targets: ['localhost:26660']
    labels:
      instance: validator
  # Host-level metrics
  - job_name: node_exporter
    static_configs:
      - targets: ['localhost:9100']
    labels:
      instance: validator
Create the systemd service:
sudo nano /etc/systemd/system/prometheus.service
[Unit]
Description=Prometheus
After=network.target
[Service]
User=prometheus
Group=prometheus
Type=simple
ExecStart=/usr/local/bin/prometheus \
  --config.file=/etc/prometheus/prometheus.yml \
  --storage.tsdb.path=/var/lib/prometheus \
  --storage.tsdb.retention.time=30d \
  --web.listen-address=0.0.0.0:9090
Restart=on-failure
[Install]
WantedBy=multi-user.target
sudo systemctl daemon-reload
sudo systemctl enable prometheus
sudo systemctl start prometheus
# Confirm it's running
sudo systemctl status prometheus
Visit http://your-server-ip:9090 — you should see the Prometheus UI. Check Status → Targets to confirm both scrape jobs are UP.
Step 4: Install Grafana
# Add Grafana APT repository
sudo apt-get install -y apt-transport-https software-properties-common
wget -q -O - https://apt.grafana.com/gpg.key | sudo apt-key add -
echo "deb https://apt.grafana.com stable main" | sudo tee /etc/apt/sources.list.d/grafana.list
sudo apt-get update
sudo apt-get install -y grafana
sudo systemctl enable grafana-server
sudo systemctl start grafana-server
Access Grafana at http://your-server-ip:3000
Default credentials: admin / admin (you'll be prompted to change on first login).
Add Prometheus as a Data Source
- Go to Connections → Data Sources → Add data source
- Select Prometheus
- Set URL to http://localhost:9090
- Click Save & Test — you should see “Data source is working”
Import a Community Dashboard
Rather than building from scratch, use the community Cosmos validator dashboard:
- Go to Dashboards → Import
- Enter dashboard ID 14914 (Cosmos Validator Dashboard by Chainode Tech)
- Select your Prometheus data source
- Click Import
This gives you an immediate view of your validator’s key metrics without writing a single PromQL query.
Step 5: Key Metrics to Watch
Once your dashboard is up, these are the metrics that matter most for a Cosmos validator:
Consensus & Signing
# Current block height — should be increasing
cometbft_consensus_height
# Missed blocks — alert if this increases rapidly
cometbft_consensus_validator_missed_blocks
# Validator voting power
cometbft_consensus_validators_power
# Number of connected peers — alert if drops below 5
cometbft_p2p_peers
Node Health
# Is the node catching up? (0 = synced, 1 = catching up)
cometbft_consensus_fast_syncing
# Mempool size
cometbft_mempool_size
# Block processing time (ms)
cometbft_consensus_block_interval_seconds
Host-Level (via node_exporter)
promql
# CPU usage %
100 - (avg by(instance) (rate(node_cpu_seconds_total{mode="idle"}[5m])) * 100)
# Memory usage %
(1 - (node_memory_MemAvailable_bytes / node_memory_MemTotal_bytes)) * 100
# Disk usage %
(1 - (node_filesystem_avail_bytes{mountpoint="/"} / node_filesystem_size_bytes{mountpoint="/"})) * 100
# Disk growth rate (bytes/hour) — useful for forecasting when you'll run out
rate(node_filesystem_size_bytes{mountpoint="/"}[1h])
Step 6: Set Up Alerting Rules
This is where monitoring becomes operational. Grafana dashboards tell you what’s happening — alerts tell you when to wake up.
Prometheus Alert Rules
Create /etc/prometheus/alerts.yml:
groups:
  - name: cosmos_validator
    rules:
      # Node is down
      - alert: ValidatorNodeDown
        expr: up{job="cosmos_node"} == 0
        for: 1m
        labels:
          severity: critical
        annotations:
          summary: "Validator node is unreachable"
          description: "Prometheus cannot scrape the validator node. It may be down."
      # Node is catching up (not in sync)
      - alert: ValidatorNotSynced
        expr: cometbft_consensus_fast_syncing == 1
        for: 5m
        labels:
          severity: warning
        annotations:
          summary: "Validator is catching up"
          description: "Node has been in fast sync mode for over 5 minutes."
      # Peer count too low
      - alert: LowPeerCount
        expr: cometbft_p2p_peers < 5
        for: 5m
        labels:
          severity: warning
        annotations:
          summary: "Low peer count: {{ $value }} peers"
          description: "Validator has fewer than 5 peers. Network connectivity may be degraded."
      # Missed blocks — 5 in last 10 minutes
      - alert: MissingBlocks
        expr: increase(cometbft_consensus_validator_missed_blocks[10m]) > 5
        labels:
          severity: critical
        annotations:
          summary: "Validator missing blocks"
          description: "{{ $value }} blocks missed in the last 10 minutes."
      # High CPU usage
      - alert: HighCPUUsage
        expr: 100 - (avg by(instance)(rate(node_cpu_seconds_total{mode="idle"}[5m])) * 100) > 85
        for: 10m
        labels:
          severity: warning
        annotations:
          summary: "High CPU usage: {{ $value }}%"
      # Disk filling up
      - alert: DiskSpaceLow
        expr: (1 - (node_filesystem_avail_bytes{mountpoint="/"} / node_filesystem_size_bytes{mountpoint="/"})) * 100 > 80
        for: 5m
        labels:
          severity: warning
        annotations:
          summary: "Disk usage above 80%: {{ $value }}%"
          description: "At current growth rate, plan for expansion soon."
      # Critical disk
      - alert: DiskSpaceCritical
        expr: (1 - (node_filesystem_avail_bytes{mountpoint="/"} / node_filesystem_size_bytes{mountpoint="/"})) * 100 > 95
        for: 1m
        labels:
          severity: critical
        annotations:
          summary: "CRITICAL: Disk nearly full at {{ $value }}%"
Reload Prometheus to pick up the rules:
sudo systemctl reload prometheus
# Verify rules loaded correctly
promtool check rules /etc/prometheus/alerts.yml
Configure Grafana Alert Notifications
To receive alerts via Telegram (most popular among Cosmos validators):
- Create a Telegram bot via @BotFather and note the bot token
- Get your chat ID by messaging @userinfobot
- In Grafana: Alerting → Contact Points → Add contact point
- Select Telegram, enter your bot token and chat ID
- Test the connection
For PagerDuty or email, Grafana supports both natively under the same menu.
Step 7: Secure Your Monitoring Stack
By default, Prometheus and Grafana are exposed on all interfaces. Lock them down:
# Firewall rules — allow Grafana only from your IP
sudo ufw allow from YOUR_IP to any port 3000
sudo ufw allow from YOUR_IP to any port 9090
# Or bind Prometheus to localhost only (edit service ExecStart)
--web.listen-address=127.0.0.1:9090
# Change Grafana default admin password immediately
# Settings → Profile → Change Password
# Disable Grafana anonymous access
sudo nano /etc/grafana/grafana.ini
# [auth.anonymous]
# enabled = false
If you’re running Prometheus + Grafana on a separate monitoring server, use a private network or WireGuard tunnel between your validator and monitoring host — never expose port 26660 publicly.
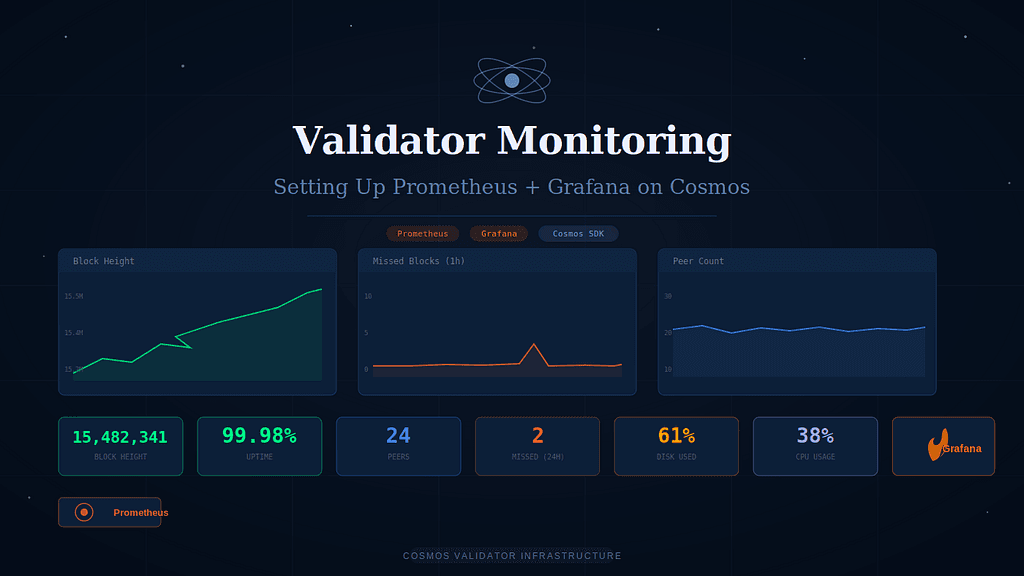
What Your Dashboard Should Show at a Glance
A well-configured Grafana dashboard should answer these questions within 5 seconds of opening:
- ✅ Is my node synced and signing blocks?
- ✅ How many peers am I connected to?
- ✅ What’s my CPU / RAM / disk usage?
- ✅ Have I missed any blocks in the last hour?
- ✅ Is disk usage trending toward a problem?
If you can’t answer all five at a glance, your dashboard needs work.
Common Issues
Metrics endpoint returns nothing Check that prometheus = true is set in config.toml and that the node has been restarted. Confirm the port with ss -tlnp | grep 26660.
Prometheus targets show as DOWN Usually a firewall issue or wrong port. Check ufw status and verify the metrics endpoint is reachable from where Prometheus is running.
Grafana shows “No data” Check the data source URL and that Prometheus is actually receiving data. Run a raw query in Prometheus UI first to confirm metrics exist.
node_exporter metrics missing Confirm the service is running with systemctl status node_exporter and that port 9100 is reachable.
Summary
The stack takes about 30–45 minutes to set up end-to-end. Once it’s running, you’ll wonder how you ever operated a validator without it.
Monitoring doesn’t prevent problems — but it ensures you’re never the last one to know when something goes wrong.
Setting Up Prometheus + Grafana for Cosmos Validator Monitoring was originally published in Vitwit on Medium, where people are continuing the conversation by highlighting and responding to this story.